

-
1 Introduction
Court employees working on multiple projects are often overwhelmed and under-resourced. To ensure engaged participation by all relevant experts, stakeholders and decision makers, it is important to have empathy for their experience of cognitive overload and information noise. Attention of the right people at the right time is the key to success in court projects, especially projects proposing a large system change such as online dispute resolution (ODR). Project management is optimized by cognitive attention management and contextual engagement of stakeholders.1xSibbet D. (2012), Visual Leaders, New Tools for Visioning, Management & Organization Change, Wiley Publishers, New York.
Engaging internal stakeholders should be thoughtfully done as better attention management of court personnel’s limited cognitive capacity and time maximizes the planning group’s ‘gestalt’ of the value, if any, of proposed new major projects. Visual facilitation can also increase stakeholder engagement to bring clarity to project design decisions. Although the up-front decision to use visual facilitation tools may take resources owing to the engagement of a visual facilitator, this will pay off in project planning.
Structured decision-making combined with visual information support provides a balanced framework for maximum engagement early on. Many of these tools are simple but profound when applied thoughtfully. -
2 Are We There Yet? How Visual Props Support Cognitive Attention Management
Innovation projects such as this ODR pilot have a lot in common with way-finding through a foreign city. We need orientation about where we are and where we are going. Project road maps are common tools to assist in orientation as they are more than metaphors. A project road map can literally provide an overview, direction and way-finding. It supports both informational and emotional needs, while keeping working attention available for the task at hand.
Visuals also support the interdisciplinary nature of ODR projects. Experts from various backgrounds contribute in the language of their own expertise. To keep people on track and make the maximum use of their expertise and time, it is helpful to reduce ‘translation’ noise and effort among members of an interdisciplinary stakeholder team. When the project manager creates a visual work culture, it becomes natural for experts to contribute in similar ways. If needed, the group can set an expectation on how expert documentation will be shared with the group.
Another benefit of a visual framework is that it makes mental models visible and explicit instead of assuming that everyone has the same model in mind; a visual framework externalizes the concepts.2xKendler J. (2004), Visual Artifacts as Decision Analysis and Support Tools, available at https://www.researchgate.net/publication/242092592_Visual_artifacts_as_decision_analysis_and_support_tools Incorrect assumptions or unrealistic expectations for the group or individuals can be revealed and addressed at an early stage so that late-stage project derailment due to miscommunication can be avoided. This visual approach has been extremely helpful for the ODR Working Group for efficient and effective collaborative decisions as it has created a common language and way of working within the group.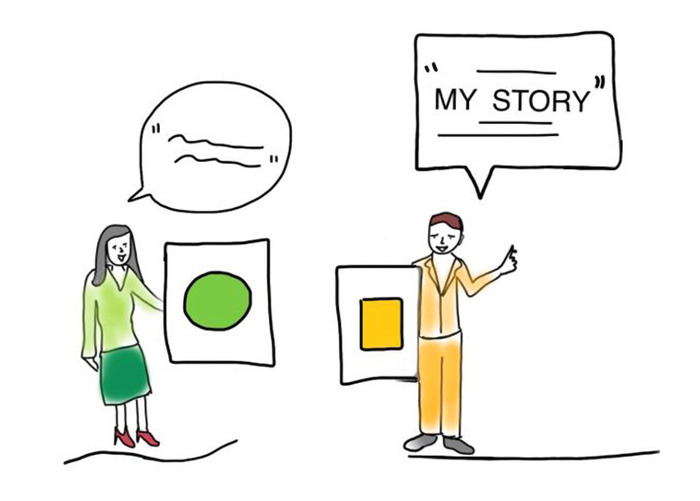
-
3 The Benefits of Decision-Making with Visual Support
The following list summarizes the benefits of using visual tools when working with a group:
Context: Easier to understand environment, find current position on road map and decide on direction
Creativity: Can incorporate design thinking and creative problem-solving and better explore process simplification
Cognitive energy: Externalizing thought process to counter tunnelling bias and allow development of multiple scenarios.
Engagement: Participants join pattern finding and identify missing elements.
The first step is to structure the decisions through methods of thinking and decision architecture.3xHuang, Peter H. (2015), Empowering People to Choose Wisely by Democratizing Mindfulness and Thinking Tools. Available at SSRN: https://ssrn.com/abstract=2639953 or http://dx.doi.org/10.2139/ssrn.2639953. Thinking architecture offers a systematic procedure to split up a complex problem into a sequence of cognitively easier thinking steps that can result in making better choices. Decision-framing is one of the methods. It is not always obvious whether there is a decision to make, an issue to discuss or a process step to naturally follow. Decision-framing makes the sequence of decisions explicit. The options to decide on can be influenced by the way they are structured. A common example is opt-in or opt-out. These general principles of decision architecture are useful to keep in mind when setting up a structured decision-making process.
The second step is to visualize the decision-making process, including the decisions to make and the scenarios to choose from. Without specific interventions, humans have a natural bias to find shortcuts or easy routes to decisions. Cognitive tunnelling bias makes people often focus only on the first option among many. “The limits of working memory generally allow the development of one to four hypotheses, only one of which is likely to receive a thorough analysis. (…) the mind tends to fixate on a single, and early developed option”.4xKendler, work cited. The take-home lesson for meeting leaders is clear: if you want to influence the outcome of the decision-making process, start with your preferred option.
As a participant, you could ask the meeting facilitator to change the order of the agenda to start with your preferred option. Visual frameworks can counter this effect, for example by providing a road map that includes all scenarios. While one option is discussed, notes can be displayed in connection with this particular option, while it remains visible to all participants that multiple options are on the table. Attention can be directed easily between different options. Options can be compared and contrasted.5xEppler M.J. and Pfister R. (2010), Drawing Conclusions, Supporting Decision Making through Collaborative Graphic Annotations, available at https://www.researchgate.net/publication/238788343_Supporting_Decision_Making_through_Collaborative_Graphic_Annotations_A_Classification_of_Sketchmarks/citation/download. “There is tremendous benefit to externalizing the cognitive task through the use of visual artifacts. When present in the context of a decision environment, displays of related information, and their visual structure, have a noticeable [positive] effect on the decision making process”.6xKendler, work cited. Project cartography can be broken down into the following activities:Show the landscape (general road map and challenges – the business context);
Pick the destination (project goal);
Identify possible routes;
Highlight the crossroads for the different routes (defined by criteria such as budget and time).
-
4 Case Study: Colorado State Courts Online Dispute Resolution Working Group
To provide some context, this is how Colorado’s ODR journey started:
2017: In the NCSC national survey 80% of respondents wanted online access to local courts, including an ability to ask for court staff guidance rather than having to make in-person trips to a physical courthouse;
January 2019: Pew Trusts launched its court modernization social initiative – to encourage state courts to adopt ODR and portals;
January 2019: Colorado State Court Administration signed a Letter of Intent with Pew Trusts and the National Center for State Courts to explore ODR;
March 2019: The State of Colorado Judicial ITS Governance Committee approved the ODR Pilot Charter;
April 2019: Colorado Office of Dispute Resolution assembled a governance group, ‘Online Dispute Resolution Working Group’, to meet regularly to explore the planning of an ODR pilot in Colorado;
The task of this working group is to design a pilot ODR project with the potential to expand implementation throughout all Colorado State courts.
The goal is to start the ODR pilot project in 2020 within a small number of test courts.
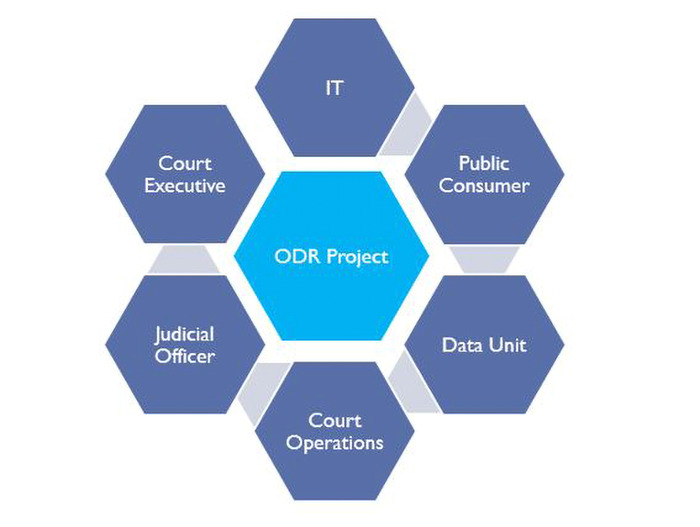
The following internal courts stakeholders are participating in the ODR Working Group:
The project manager worked with a staff member who was also trained in visual facilitation; together we worked with the following main ideas on cognitive attention management:
Keep it simply simple (KISS) – participate only in small bits of the entire group of diverse stakeholders;
Use remote videoconference to make meeting participation and recordation easy – those who are unable to attend can watch recorded meetings to stay current with the discussion;
Limit meetings to one hour, one decision/topic;
Set up online discussion forums for documents, dialogue and links to recorded meetings so that it is easy and fast for all to know where you are in the process;
Make smart use of people’s working attention: provide ‘just in time’ concise information prior to each meeting, selected only for the decision to make. Post the information on the online discussion boards.
The project manager should take an active lead as the information curator by sifting through relevant information with an eye to synthesizing the information needed for a particular decision. The project manager can then shares bite-sized portions of information rather than sharing long, text heavy documents. This can be balanced for reference and transparency, by keeping a layered information system that provides access to all docs in the online discussion board.
Provide a simple and clear visual framework at the beginning of each meeting to provide overview, while clarifying what decision is the subject of the current meeting.
These ideas were incorporated in the project design with the following practical tools and philosophy:
Limit meetings to online meetings and online project documentation location
Commit to short meetings: one hour, one decision
Create small subgroups of 2-4 people to make recommendations to the larger group when needed (e.g. process simplification, draft requests for information, etc.)
Use structured decision-making practices
Orient participants by using visual tools
The following two visual tools provide examples of how the project manager worked with the visual facilitator to track the ODR Working Group decision-making milestones over the course of the planning phase and to develop a visual decision-making matrix. The goals of the visual tools are to generate options for decisions in a non-biased way and then to apply mutually agreed upon criteria with which to evaluate those options (Figs. 1 and 2).
One meeting one decision. The decision milestones are illustrated with completed decisions in dark blue and future decisions in light blue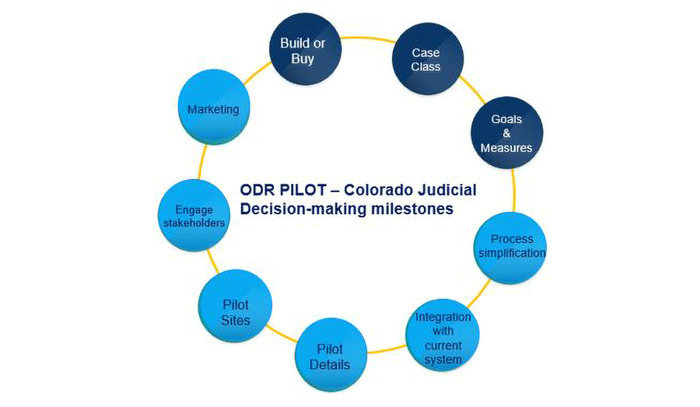 This shows a risk benefit analysis that invites stakeholders to develop their own scoring sheets based on standardized criteria. Visuals will allow a quick understanding of the decision criteria and avoid biases that often lead to arbitrary decisions
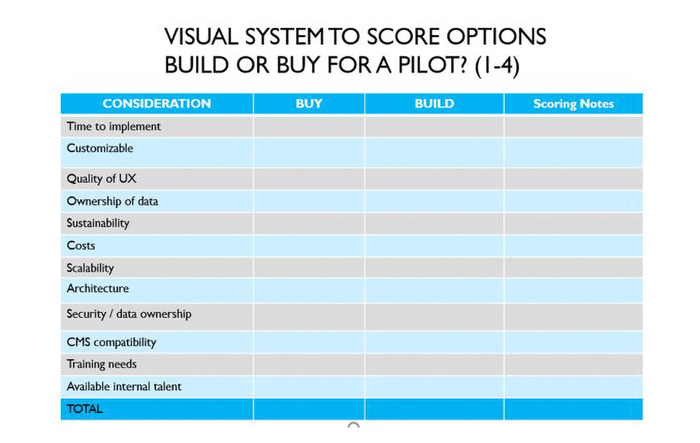
-
5 Summary
This presentation provided a case study on how one state used visual tools to assist in planning an ODR pilot project. The need to present information visually as well as to create a common road map are simple yet powerful planning tools7xFind practical tools and templates at Diagrammer.com – free PowerPoint templates by Duarte design and at://diytoolkit.org/. for multidisciplinary stakeholder planning teams. Visual facilitators can ease cognitive overload and minimize decision biases so that better team decisions will result.
-
1 Sibbet D. (2012), Visual Leaders, New Tools for Visioning, Management & Organization Change, Wiley Publishers, New York.
-
2 Kendler J. (2004), Visual Artifacts as Decision Analysis and Support Tools, available at https://www.researchgate.net/publication/242092592_Visual_artifacts_as_decision_analysis_and_support_tools
-
3 Huang, Peter H. (2015), Empowering People to Choose Wisely by Democratizing Mindfulness and Thinking Tools. Available at SSRN: https://ssrn.com/abstract=2639953 or http://dx.doi.org/10.2139/ssrn.2639953.
-
4 Kendler, work cited.
-
5 Eppler M.J. and Pfister R. (2010), Drawing Conclusions, Supporting Decision Making through Collaborative Graphic Annotations, available at https://www.researchgate.net/publication/238788343_Supporting_Decision_Making_through_Collaborative_Graphic_Annotations_A_Classification_of_Sketchmarks/citation/download.
-
6 Kendler, work cited.
-
7 Find practical tools and templates at Diagrammer.com – free PowerPoint templates by Duarte design and at://diytoolkit.org/.
DOI: 10.5553/IJODR/235250022019006002012
International Journal of Online Dispute Resolution |
|
| Article | Making Project Decisions VisibleOnline Dispute Resolution Project Design, Structured Decision-Making and Visual Information Tools |
| Keywords | visual facilitation, cognitive overload, decision-framing, online dispute resolution project planning |
| Authors | Sharon Sturges en Susanne van der Meer |
| DOI | 10.5553/IJODR/235250022019006002012 |
|
Show PDF Show fullscreen Abstract Author's information Statistics Citation |
| This article has been viewed times. |
| This article been downloaded 0 times. |
Suggested citation
Sharon Sturges and Susanne van der Meer, "Making Project Decisions Visible", International Journal of Online Dispute Resolution, 2, (2019):202-208
Sharon Sturges and Susanne van der Meer, "Making Project Decisions Visible", International Journal of Online Dispute Resolution, 2, (2019):202-208
|
The authors presented on this topic during the International ODR Forum 2019 in Williamsburg, Virginia. The goal of this presentation was to share practices and ideas that have worked well in the design phase of an Online Dispute Resolution (ODR) pilot project for the State Courts of Colorado. |